USGS potential evapotranspiration data
The USGS daily global potential evapotranspiration (PET) is estimated using climate parameters extracted from the Global Data Assimilation System (GDAS), which is run every six hours by the National Oceanic and Atmospheric Administration (NOAA). Its data resolution is 1° by 1°. The data availability is from January 1, 2001. However, its web interface is limited to a single-year, single-month, or single-day download. The unit of this data product is 0.01 mm, which means a cell value of 1 indicates a daily potential evapotranspiration of 0.01 mm.
Downloading PET data
Direct downloads are available from
Using fetch_usgs_pet.py, download PET data.
fetch_usgs_pet.py 2010-01-01 2020-12-31
Extracting data for the watershed
From the epsg4326 location, import all the files using import_usgs_pet.sh.
Find the centroid of the watershed.
v.to.db map=watershed option=coor columns=x,y
v.to.db map=watershed option=area columns=area_km2 units=kilometers
v.db.select map=watershed
The major centroid is at -83.6274554161366,34.6959628598932.
for i in $(g.list type=raster pattern=et*); do
    r.what map=$i coordinates=-83.6274554161366,34.6959628598932 | sed 's/.*|/0.00001*/' | bc
done > usgs_pet.txt
Creating input files
Replace NCDC EVAP data in input_evap.txt with this data and create a new input_pet.txt file.
head -9 input_evap.txt > input_pet.txt
tail +10 input_evap.txt | sed 's/ .*//' > ncdc_prcp.txt
tail +10 input_evap.txt | sed 's/.* //' > ncdc_evap.txt
paste ncdc_prcp.txt usgs_pet.txt >> input_pet.txt
Comparing EVAP and PET data
In R, let’s compare EVAP and PET data.
evap <- read.table("ncdc_evap.txt")[[1]]
pet <- read.table("usgs_pet.txt")[[1]]
boxplot(data.frame(evap, pet))

plot(evap, type="l")
lines(pet, col="red")
legend("topleft", legend=c("evap", "pet"), lty=c(1, 1), col=c("black", "red"), bty="n")
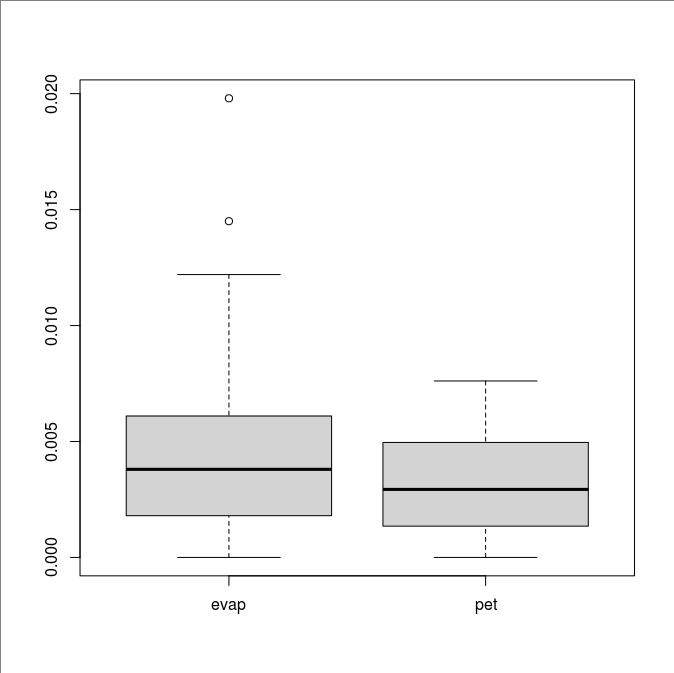
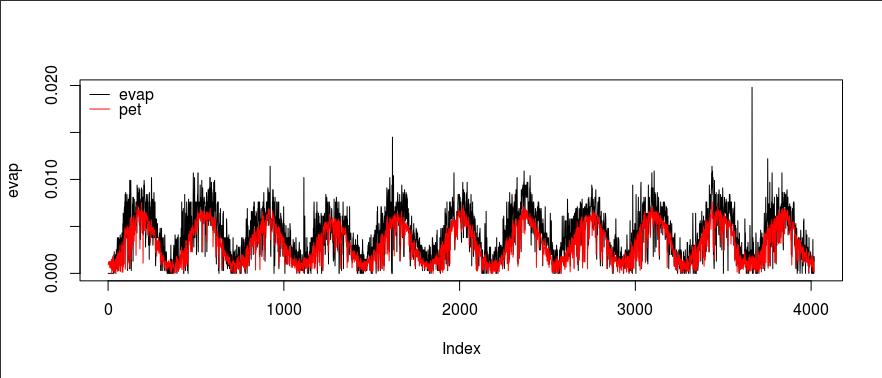
Overall, EVAP data is greater than PET data.